Here we demonstrate this paradox in estimates of first-dose COVID-19 vaccine uptake in US adults from 9 January to 19 May 2021 from two large surveys: Delphi–Facebook2,3 (about 250,000 responses per week) and Census Household Pulse4 (about 75,000 every two weeks).
In May 2021, Delphi–Facebook overestimated uptake by 17 percentage points (14–20 percentage points with 5% benchmark imprecision) and Census Household Pulse by 14 (11–17 percentage points with 5% benchmark imprecision), compared to a retroactively updated benchmark the Centers for Disease Control and Prevention published on 26 May 2021.
Moreover, their large sample sizes led to miniscule margins of error on the incorrect estimates.
By contrast, an Axios–Ipsos online panel5 with about 1,000 responses per week following survey research best practices6 provided reliable estimates and uncertainty quantification.
We show how a survey of 250,000 respondents can produce an estimate of the population mean that is no more accurate than an estimate from a simple random sample of size 10.
Governments, businesses and researchers rely on survey data to inform the provision of government services7, steer business strategy and guide the response to the COVID-19 pandemic8,9.With the ever-increasing volume and accessibility of online surveys and organically collected data, the line between traditional survey research and Big Data is becoming increasingly blurred10.
Instead, small biases are compounded as sample size increases1.
We see initial evidence of this in the discrepancies in estimates of first-dose COVID-19 vaccine uptake, willingness and hesitancy from three online surveys in the US.Two of them—Delphi–Facebook’s COVID-19 symptom tracker2,3 (around 250,000 responses per week and with over 4.5 million responses from January to May 2021) and the Census Bureau’s Household Pulse survey4 (around 75,000 responses per survey wave and with over 600,000 responses from January to May 2021)—have large enough sample sizes to render standard uncertainty intervals negligible; however, they report significantly different estimates of vaccination behaviour with nearly identically worded questions (Table 1).
For example, Delphi–Facebook’s state-level estimates for willingness to receive a vaccine from the end of March 2021 are 8.5 percentage points lower on average than those from the Census Household Pulse (Extended Data Fig. 1a), with differences as large as 16 percentage points.
The US Centers for Disease Control and Prevention (CDC) compiles and reports vaccine uptake statistics from state and local offices13.These figures serve as a rare external benchmark, permitting us to compare survey estimates of vaccine uptake to those from the CDC.
The CDC has noted the discrepancies between their own reported vaccine uptake and that of the Census Household Pulse14,15, and we find even larger discrepancies between the CDC and Delphi–Facebook data (Fig. 1a).
None of these surveys use the CDC benchmark to adjust or assess their estimates of vaccine uptake, thus by examining patterns in these discrepancies, we can infer each survey’s accuracy and statistical representativeness, a nuanced concept that is critical for the reliability of survey findings16,17,18,19.
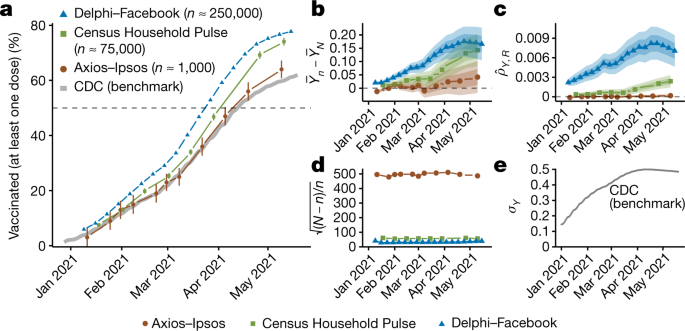
a, Estimates of vaccine uptake for US adults in 2021 compared to CDC benchmark data, plotted by the end date of each survey wave.Points indicate each study’s weighted estimate of first-dose vaccine uptake, and intervals are 95% confidence intervals using reported standard errors and design effects.
Delphi–Facebook has n = 4,525,633 across 19 waves, Census Household Pulse has n = 606,615 across 8 waves and Axios–Ipsos has n = 11,421 across 11 waves.
c, Data defect correlation \({\hat{\rho }}_{Y,R}\).
d, Data scarcity \(\sqrt{(N-n)/n}\).
We focus on the Delphi–Facebook and Census Household Pulse surveys because their large sample sizes (each greater than 10,000 respondents20) present an opportunity to examine the Big Data Paradox1 in surveys.The Census Household Pulse is an experimental product designed to rapidly measure pandemic-related behaviour.
Delphi–Facebook has stated that the intent of their survey is to make comparisons over space, time and subgroups, and that point estimates should be interpreted with caution3.
However, despite these intentions, Delphi–Facebook has reported point estimates of vaccine uptake in its own publications11,21.
Delphi–Facebook and Census Household Pulse surveys persistently overestimate vaccine uptake relative to the CDC’s benchmark (Fig. 1a) even taking into account Benchmark Imprecision (Fig. 1b) as explained in ‘Decomposing Error in COVID Surveys’.Despite being the smallest survey by an order of magnitude, the estimates of Axios–Ipsos track well with the CDC rates (Fig. 1a), and their 95% confidence intervals contain the benchmark estimate from the CDC in 10 out of 11 surveys (an empirical coverage probability of 91%).
One might hope that estimates of changes in first-dose vaccine uptake are correct, even if each snapshot is biased.However, errors have increased over time, from just a few percentage points in January 2021 to Axios-Ipsos’ 4.2 percentage points [1–7 percentage points with 5% benchmark imprecision (BI)], Census Household Pulse’s 14 percentage points [5% BI: 11–17] and Delphi-Facebook’s 17 percentage points [5% BI: 14–20] by mid-May 2021 (Fig. 1b).
Conventional statistical formulas for uncertainty further mislead when applied to biased big surveys because as sample size increases, bias (rather than variance) dominates estimator error.Figure 1a shows 95% confidence intervals for vaccine uptake based on the reported sampling standard errors and weighting design effects of each survey23.
Axios–Ipsos has the widest confidence intervals, but also the smallest design effects (1.1–1.2), suggesting that its accuracy is driven more by minimizing bias in data collection rather than post-survey adjustment.
The 95% confidence intervals of Census Household Pulse are widened by large design effects (4.4–4.8) but they are still too narrow to include the true rate of vaccine uptake in almost all survey waves.
The confidence intervals for Delphi–Facebook are extremely small, driven by large sample size and moderate design effects (1.4–1.5), and give us a negligible chance of being close to the truth.
However, relative to the CDC’s contemporaneously reported state-level estimates, which did not include retroactive corrections, Delphi–Facebook and Census Household Pulse overestimated CDC state-level vaccine uptake by 16 and 9 percentage points, respectively (Extended Data Fig. 1g, h) in March 2021, and by equal or larger amounts by May 2021 (Extended Data Fig. 2g, h).
Relative estimates were no better than absolute estimates in March of 2021: there is little agreement in a survey’s estimated state-level rankings with the CDC (a Kendall rank correlation of 0.31 for Delphi–Facebook in Extended Data Fig. 1i and 0.26 for Census Household Pulse in Extended Data Fig. 1j) but they improved in May of 2021 (correlations of 0.78 and 0.74, respectively, in Extended Data Fig. 2i, j).
Among 18–64-year-olds, both Delphi–Facebook and Census Household Pulse overestimate uptake, with errors increasing over time (Extended Data Fig. 6).
This is thev Big Data Paradox: “the bigger the data, the surer we fool ourselves”1 when we fail to account for bias in data collection.
The effect of data quantity is captured by ‘data scarcity’, which is a function of the sample size n and the population size N, measured as \(\sqrt{(N-n)/n},\) and hence what matters for error is the relative sample size—that is, how close n is to N—rather than the absolute sample size n.
These scenarios were chosen on the basis of analysis of the magnitude by which the CDC’s initial estimate for vaccine uptake by a particular day increases as the CDC receives delayed reports of vaccinations that occurred on that day (Extended Data Fig. 3, Supplementary Information A.2).
The total error of each survey’s estimate of vaccine uptake (Fig. 1b) increases over time for all studies, most markedly for Delphi–Facebook.The data quality defect, measured by the ddc, also increases over time for Census Household Pulse and for Delphi–Facebook (Fig. 1c).
The data scarcity,\(\sqrt{(N-n)/n},\) for each survey is roughly constant across time (Fig. 1d).
Therefore, the decomposition suggests that the increasing error in estimates of vaccine uptake in Delphi–Facebook and Census Household Pulse is primarily driven by increasing ddc, which captures the overall effect of the bias in coverage, selection and response.
Equation (1) also yields a formula for the bias-adjusted effective sample size neff, which is the size of a simple random sample that we would expect to exhibit the same level of mean squared error (MSE) as what was actually observed in a given study with a given ddc.For estimating the US vaccination rate, Delphi–Facebook has a bias-adjusted effective sample size of less than 10 in April 2021, a 99.99% reduction from the raw average weekly sample size of 250,000 (Fig. 2).The Census Household Pulse is also affected by over 99% reductions in effective sample size by May 2021.
An estimate’s bias-adjusted effective sample size (different from the classic Kish effective sample size) is the size of a simple random sample that would have the same MSE as the observed estimate.The original sample size was n = 4,525,633 across 19 waves for Delphi–Facebook, n = 606,615 across 8 waves for Census Household Pulse and n = 11,421 across 11 waves for Axios–Ipsos.
Table 1 compares the design of each survey (more details in ‘Additional survey methodology’ in the Methods, Extended Data Table 1).
The Delphi–Facebook survey recruits respondents from active Facebook users (the Facebook active user base, or FAUB) using daily unequal-probability stratified random sampling2.
The Census Bureau uses a systematic random sample to select households from the subset of the master address file (MAF) of the Census for which they have obtained either cell phone or email contact information (approximately 81% of all households in the MAF)4.
Unlike the Census Household Pulse, potential respondents are not limited to the subset for whom email and phone contact information is available.
In 2021, this ‘offline’ group typically comprises 1% of the final survey (Extended Data Table 1).
Axios–Ipsos and Census Household Pulse also weight on education and race and/or ethnicity (hereafter, race/ethnicity).
As noted before, none of the surveys use the CDC benchmark to adjust or assess estimates of vaccine uptake.
Axios–Ipsos samples mimic the actual breakdown of education attainment among US adults even before weighting, whereas those of Census Household Pulse and Delphi–Facebook do not.
After weighting, Axios–Ipsos and Census Household Pulse match the population benchmark, by design.
Delphi–Facebook does not explicitly weight on education, and hence the education bias persists in their weighted estimates: those without a college degree are underrepresented by nearly 20 percentage points.
Delphi–Facebook’s weighting scheme does not adjust for race/ethnicity, and hence their weighted sample still overrepresents white adults by 8 percentage points, and underrepresents the proportions of Black and Asian individuals by around 50% of their size in the population (Table 2).
In other words, reweighting the Delphi–Facebook survey to upweight racial minorities will bring willingness estimates closer to Household Pulse and the vaccination rate closer to CDC.
Census Household Pulse weights on both race and education4 and still overestimates vaccine uptake by over ten points in late May of 2021 (Fig. 1b).
Delphi–Facebook and Census Household Pulse may be unrepresentative with respect to political partisanship, which has been found to be correlated with vaccine behaviour38 and with survey response39, and thus may contribute to observed bias.However, neither Delphi–Facebook nor Census Household Pulse collects partisanship of respondents.
Neither Census Household Pulse nor Delphi–Facebook weights on sub-state geography, which may mean that adults in more rural areas who are less likely to be vaccinated are also underrepresented in the two surveys, leading to overestimation of vaccine uptake.
We find that dropping these offline respondents (n = 21, or 1% of the sample) in their 22 March 2021 wave increases Axios–Ipsos’ overall estimate of the vaccination rate by 0.5 percentage points, thereby increasing the total error (Extended Data Table 2).
However, this offline population is too small to explain the entirety of the difference in accuracy between Axios–Ipsos and either Census Household Pulse (6 percentage points) or Delphi–Facebook (14 percentage points), in this time period.
For example, reweighting Axios–Ipsos 22 March 2021 wave using only Delphi–Facebook’s weighting variables (age group and gender) increased the error in their vaccination estimates by 1 percentage point, but this estimate with Axios–Ipsos data is still more accurate than that from Delphi–Facebook during the same period (Extended Data Table 2).
In multi-stage sampling, which includes for example the selection of potential respondents followed by non-response, bias in even a single step can substantially affect the final result (‘Population size in multi-stage sampling’ in the Methods, Extended Data Table 3).
A total quality control approach, inspired by the total survey error framework41, is a better strategy than trying to prioritize some components over others to improve data quality.
This emphasis is a reaffirmation of the best practice for survey research as advocated by the American Association for Public Opinion Research:6 “The quality of a survey is best judged not by its size, scope, or prominence, but by how much attention is given to [preventing, measuring and] dealing with the many important problems that can arise.”42.
A limitation of our vaccine uptake analysis is that we only examine ddc with respect to an outcome for which a benchmark is available: first-dose vaccine uptake.One might hope that surveys biased on vaccine uptake are not biased on other outcomes, for which there may not be benchmarks to reveal their biases.
In other words, when a survey loses its overall statistical representativeness (for example, through bias in coverage or non-response), which is difficult to repair (for example, by weighting or modelling on observable characteristics) and almost impossible to verify45, researchers who wish to use the survey for scientific studies must supply other reasons to justify the reliability of their survey estimates, such as evidence about the independence between the variable of interest and the factors that are responsible for the unrepresentativeness.Some may argue that bias is a necessary trade-off for having data that are sufficiently large for conducting highly granular analysis, such as county-level estimation of vaccine hesitancy26.We further note that bias is not limited to population point estimates, but also affects estimates of changes over time (contrary to published guidance3). Both Delphi–Facebook and Census Household Pulse significantly overestimate the slope of vaccine uptake relative to that of the CDC benchmark (Fig. 1b).
The accuracy of our analysis does rely on the accuracy of the CDC’s estimates of COVID vaccine uptake.Delphi–Facebook is “the largest public health survey ever conducted in the United States”47.
The Census Household Pulse is conducted in collaboration between the US Census Bureau and eleven statistical government partners, all with enormous resources and survey expertise.
Both studies take steps to mitigate selection bias, but substantially overestimate vaccine uptake.
As we have shown, the effect of bias is magnified as relative sample size increases.
Small surveys can be just as wrong as large surveys in expectation—of the three other small-to-medium online surveys additionally analysed, two also miss the CDC vaccination benchmark (Extended Data Fig. 5).
Of course, a sample size of 1,000 may be too small (that is, leading to unhelpfully large uncertainty intervals) for the kind of 50-state analyses made possible by big surveys.
For COVID-19 surveys in particular, since June 2021, the AP–NORC multimode panel has weighted their COVID-19 related surveys to the CDC benchmark, so that the weighted ddc for vaccine uptake is zero by design49.
Although more needs to be done to fully examine the nuances of large surveys, organically collected administrative datasets and social media data, we hope that this comparative study of ddc highlights the concerning implications of the Big Data Paradox—how large sample sizes magnify the effect of seemingly small defects in data collection, which leads to overconfidence in incorrect inferences.In the case of a single survey wave of a COVID-19 survey, n is the sample size of the survey wave, N is the population size of US adults from US Census estimates55, \({\overline{Y}}_{n}\) is the survey estimate of vaccine uptake and \({\overline{Y}}_{N}\) is the estimate of vaccine uptake for the corresponding period taken from the CDC’s report of the cumulative count of first doses administered to US adults8,13.
However, with this calculation method, \({\hat{\rho }}_{Y,R}\) lacks the direct interpretation as a correlation between Y and R, and instead becomes a more general index of data quality directly related to classical design effects (see ‘Bias-adjusted effective sample size’).
It is important to point out that the increase in ddc does not necessarily imply that the response mechanisms for Delphi–Facebook and Census Household Pulse have changed over time.The data quality framework given by equations (1) and (2) is a special case of a more general framework for assessing the actual error of a weighted estimator \({\overline{Y}}_{w}=\frac{{\sum }_{i}{w}_{i}{R}_{i}{Y}_{i}}{{\sum }_{i}{w}_{i}{R}_{i}}\), where \({w}_{i}\) is the survey weight assigned to individual \(i\).Equation (3) precisely describes this trade-off, providing a formula to assess when the reduction of ddc is significant to outweigh the reduction of the effective sample size.
Measuring the correlation between Y and R is not a new idea in survey statistics (though note that ddc is the population correlation between Y and R, not the sample correlation), nor is the observation that as sample size increases, error is dominated by bias instead of variance56,57.The new insight is that ddc is a general metric to index the lack of representativeness of the data we observe, regardless of whether or not the sample is obtained through a probabilistic scheme, or weighted to mimic a probabilistic sample.
Furthermore, the ddc framework refutes the common belief that increasing sample size necessarily improves statistical estimation1,58.
By matching the mean-squared error of \({\overline{Y}}_{w}\) with the variance of the sample average from simple random sampling, Meng1 derives the following formula for calculating a bias-adjusted effective sample size, or neff:.Given an estimator \({\overline{Y}}_{w}\) with expected total MSE T due to data defect, sampling variability and weighting, this quantity neff represents the size of a simple random sample such that its mean \({\bar{Y}}_{N}\), as an estimator for the same population mean \({\overline{Y}}_{N}\), would have the identical MSE T.Therefore, the only source of error is the sampling variation, which is typically negligible for large surveys such as Delphi–Facebook and the Census Household Pulse.
For the more general setting in which \({\overline{Y}}_{w}\) may be biased, we replace the variance by MSE, and hence the bias-adjusted design effect \({D}_{e}=E[{Z}_{{\rm{w}}}^{2}]\), which is the MSE relative to the benchmark measured in the unit of the variance of an average from a simple random sample of size nw.
But because we estimate \({D}_{I}\) by \(\frac{{Z}_{w}^{2}}{N}\) directly, our effective sample size calculation is still valid even when equation (3) does not hold.
This result may be counterintuitive in the traditional survey statistics framework, which often considers how error changes as sample size n grows.
The ddc framework considers a more general set-up, taking into account individual response behaviour, including its effect on sample size itself.
In Supplementary Information B.1, we prove that ddc cannot vanish as N grows, nor can the observed sample size n ever approach 0 or N for a given set of (finite and plausible) values of {α, β}, because there will always be a non-trivial percentage of non-respondents.
We have shown that the asymptotic behaviour of error depends on whether the data collection process is driven by individual response behaviour or by survey design.Extended Data Table 3 takes as an example the sampling stages of the Census Household Pulse, which has the most extensive set of documentation among the three surveys we analyse.As we have summarized (Table 1, Extended Data Table 1), the Census Household Pulse (1) first defines the sampling frame as the reachable subset of the MAF, (2) takes a random sample of that population to prompt (send a survey questionnaire) and (3) waits for individuals to respond to that survey.
Each of these stages reduces the desired data size, and the corresponding population size is the intended sample size from the prior stage (in notation, Ns = ns −1, for s = 2, 3).
For example, in stage 3, the population size N3 is the size of the intended sample size n2 from the second stage (random sample of the outreach list), because only the sampled individuals have a chance to respond.
Although all stages contribute to the overall ddc, the stage that dominates is the first stage at which the representativeness of our sample is destroyed—the size of which will be labelled as the dominating population size (dps)—when the relevant population size decreases markedly at each step.For example, if the 20% of the MAFs excluded from the Census Household Pulse sampling frame (because they had no cell phone or email contact information) is not representative of the US adult population, then the dps is N1, or 255 million adults contained in 144 million households.Given our existing knowledge about online–offline populations40 and our analysis of Axios–Ipsos’ small ‘offline’ population, Census Household Pulse may suffer from unrepresentativeness at Stage 1 of Extended Data Table 3, where N = 255 million, and Delphi–Facebook may suffer from unrepresentativeness at the initial stage of starting from the Facebook user base.
Analyzing several snapshots before 26 May 2021, we find that these retroactive updates 40 days out could change the initial estimate by about 5% (Extended Data Fig. 3), hence informing our sensitivity analysis of +/− 5% and 10% benchmark imprecision.
The Census Household Pulse and Delphi–Facebook surveys are the first of their kind for each organization, whereas Ipsos has maintained their online panel for 12 years.Delphi–Facebook and Census Household Pulse ask similar questions (“Have you had/received a COVID-19 vaccination/vaccine?”).
Nonetheless, Axios–Ipsos’ question wording does differ from that of the other two surveys, and may contribute to the observed differences in estimates of vaccine uptake across surveys.
Census Household Pulse sets the denominator of their percentages as the household civilian, non-institutionalized population in the United States of 18 years of age or older, excluding Puerto Rico or the island areas.
To estimate the size of the total US population, we use the US Census Bureau Annual Estimates of the Resident Population for the United States and Puerto Rico, 201955.
Axios–Ipsos and Delphi–Facebook generate target distributions of the US adult population using the Current Population Survey (CPS), March Supplement, from 2019 and 2018, respectively.Census Household Pulse uses a combination of 2018 1-year American Community Survey (ACS) estimates and the Census Bureau’s Population Estimates Program (PEP) from July 2020.
The Census Household Pulse is an experimental product of the US Census Bureau in collaboration with eleven other federal statistical agencies.We use the point estimates presented in Data Tables, as well as the standard errors calculated by the Census Bureau using replicate weights.
The Delphi–Facebook COVID symptom survey is an ongoing survey collaboration between Facebook, the Delphi Group at Carnegie Mellon University (CMU), and the University of Maryland2.The Delphi–Facebook data used here were downloaded directly from CMU’s repository for weekly contingency tables with point estimates and standard errors.
Data were collected from publicly available repositories of survey data by downloading the data directly or using APIs.
Design and Operation of the 2020 Household Pulse Survey (U.S. Census Bureau, 2020)P
Using the COVID-19 Symptom Survey to track vaccination uptake and sentiment in the United States.
Comparison of COVID-19 vaccination coverage estimates from the Household Pulse Survey, Omnibus Panel Surveys, and COVID-19 vaccine administration data, United States, March 2021.
Sociodemographic factors associated with receipt of COVID-19 vaccination and intent to definitely get vaccinated, adults aged 18 years or above—Household Pulse Survey, United States, April 28–May 10, 2021.
Impact and effectiveness of mRNA BNT162b2 vaccine against SARS-CoV-2 infections and COVID-19 cases, hospitalisations, and deaths following a nationwide vaccination campaign in Israel: an observational study using national surveillance data.
Time trends and factors related to COVID-19 vaccine hesitancy from january-may 2021 among US adults: findings from a large-scale national survey.
Estimates of vaccine hesitancy for COVID-19 (2021).
Sources of error in survey and administrative data: the importance of reporting procedures.
American Community Survey Report NoJ
Methodology for the United States population estimates: Vintage 2019.
We further thank the Delphi Group at CMU for their help in computing weekly design effects for their survey; the Ipsos team for providing data on their ‘offline’ respondents; the CDC for responding to our questions; S.
Comparison of Delphi-Facebook and Census Household Pulse’s state-level point estimates (a–c) and rankings (d–f) for vaccine hesitancy, willingness and uptake Dotted black lines show agreement and red points show the average of 50 states.g–j compare state-level point estimates and rankings for the same survey waves to CDC benchmark estimates from 31 March 2021.
The Delphi–Facebook data are from the week ending 27 March 2021 and the Census Household Pulse is the wave ending 29 March 2021.
See Extended Data Fig.
Comparison of Delphi-Facebook and Census Household Pulse’s state-level point estimates (a–c) and rankings (d–f) for vaccine hesitancy, willingness and uptake.g–j compare state-level point estimates and rankings for the same survey waves to CDC benchmark estimates from 15 May 2021.
The Delphi–Facebook data are from the wave week ending 8 May 2021 and the Census Household Pulse is the wave ending 10 May 2021.
See Extended Data Fig
Increase is shown as a percentage of the vaccine uptake reported on 12 AprilMost of the retroactive increases in reported estimates appear to occur in the first 10 days after an estimate is first reported
YouGov surveys are not analysed because they explicitly examined how their surveys tracked CDC vaccine uptake. See Supplementary Information C.3 for the sampling methodology of each survey and discussion of differences
a, Estimates of vaccine uptake from Delphi–Facebook (blue) and Census Household Pulse (green) for 18–64-year-olds (left) and those aged 65 or older (right)Bounds on the CDC’s estimate of vaccine uptake for those groups are shown in grey
b, Unweighted ddc for each Delphi–Facebook and Census Household Pulse calculated for the 18–64 group using the bounds on the CDC’s estimates of uptake
ddc for 65+ is not shown due to large uncertainty in the bounded CDC estimates of uptake
Unrepresentative big surveys significantly overestimated US vaccine uptake